Bowers cross plot - Velocity vs Effective Stress
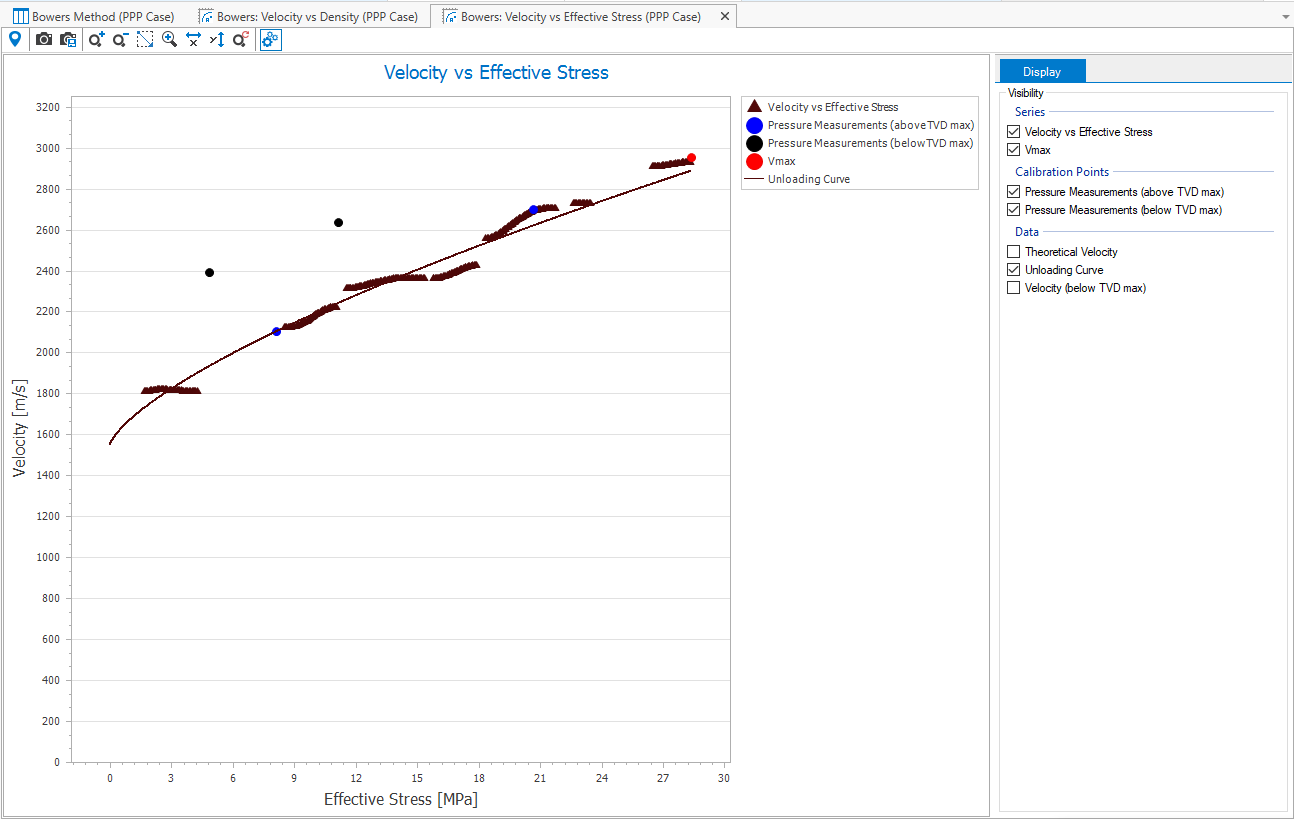
The Velocity vs Effective Stress cross plot with various velocity and calibration data displayed click to enlarge
The Velocity vs Effective Stress cross plot is used to verify that unloading is present in the subsurface and to check and review the output of the various calculations in the Bower's Method workflow. The cross plot can be opened via the Bowers Eq Depth or the Bowers Unloading forms in the 1D Model > Pore Pressure sub-strip. To aid in determining and refining the input parameters for the Bowers Unloading pore pressure, the following data can be displayed and analyzed in the cross plot:
- Velocity vs Effective Stress, theoretical velocity as calculated in the Bowers Eq Depth form versus the effective stress calculated in the Effective Overburden form
- Vmax, as specified in the V0 and Vmax form
- Pressure measurements (calibration points) above and below TVDSS max
- Theoretical velocity, as calculated in the Bowers Eq Depth form
- Bower's Unloading Curve
- Velocity (below TVD max)
The cross plot is designed to work together with the Bowers Eq Depth and Bowers Unloading forms. As you perform the calculations in each form you can return to this cross plot to observe the results. Depending on the results, you can then return to the respective form and adjust and refine the parameters of your calculations.
Bowers: Velocity vs Effective Stress cross plot toolbar
The following options can be accessed via the toolbar located just above the view:

|
Probe tool When activated, hover over the data in the view to display the object and property data. |

|
Copy view to clipboard Copy the current view to the clipboard for use in other applications. |

|
Save view to file Save the current view to a file with a name and location you specify. |

|
Zoom in Incrementally zoom in on the view. |

|
Zoom out Incrementally zoom out on the view. |
|
|
Zoom rectangle Turns the cursor into a zooming tool. When this option is active click and drag a box around the data you want to view in better detail. |
|
|
Zoom on both axes Incrementally zooms in equally along both axes. |
|
|
Zoom on the horizontal axis Zooms the view only along the horizontal direction. |
|
|
Zoom on the vertical axis Zooms the view only along the vertical direction. |
|
|
Reset zoom Clear all zoom changes. |
|
|
Options Shows all the display options. |
View context menu
Right mouse click anywhere in the view to activate the context menu:
- Use Lock Axes from the context menu to prevent the axes from being changed after a recalculation.
- Use Options from the context menu to open an new dialog. On this dialog, you can change the display settings for the chart, pane, axes, series, titles and legend.
- Use Export from the context menu to copy the series data of the plot to the clipboard.